Jun 2025 · Security · Graph ML · PyTorch Geometric · 2 min read
Attacks are relational — your detection should be too
Detecting credential stuffing in real production auth logs with Graph Auto-Encoders: why modeling logins as a graph beat row-by-row analysis, and what a 0.37 → 0.93 AUC jump taught me.
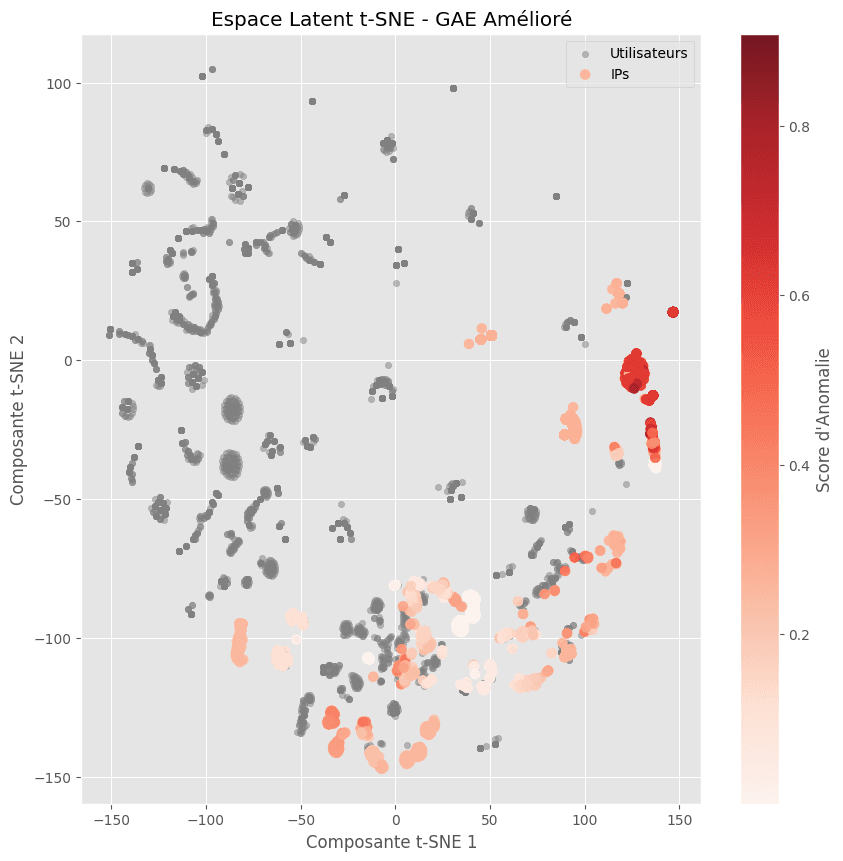
t-SNE of the embeddings learned by the improved graph auto-encoder: users in grey, IPs coloured by anomaly score. Figure from the project repository.
Rule-based intrusion detection reads authentication logs one row at a time: this IP failed too often, block it. Modern attacks don't work one row at a time. In a credential stuffing campaign, one actor tests thousands of stolen credentials across many accounts, rotating IPs and user-agents to stay under every per-row threshold.
The signal isn't in any single event. It's in the relationships — one IP touching many accounts, one account touched from many places. For my engineering project at Télécom Saint-Étienne, working on real (pseudonymized) production authentication logs from an industry partner, I modeled the problem the way it actually behaves: as a graph.
Logins as a heterogeneous graph
Users, IP addresses and user-agents become nodes; login events become edges between them. A normal user produces a tight, boring subgraph — few IPs, few devices, regular rhythm. A stuffing campaign produces a structural anomaly: a hub IP fanning out to hundreds of accounts.
On top of this graph I trained Graph Auto-Encoders (GAE, then variational VGAE) with PyTorch Geometric. The model learns to reconstruct the graph's "normal" connective structure; edges it struggles to reconstruct are the anomalies. No labeled attacks needed — which matters, because labeled attack data is exactly what you never have in production.
The result that taught me the most
The first pure-structure model scored a 0.37 test AUC — worse than a coin flip. The graph shape alone wasn't enough.
The fix wasn't a bigger model. It was feature engineering: injecting behavioral attributes into the nodes — per-user connection frequency, user-agent diversity, per-IP failure rate — before training the same auto-encoder. Same architecture, richer nodes: 0.93 AUC, 0.96 average precision.
That's the lesson I keep from this project. In applied ML the leverage is rarely in the architecture; it's in how much domain knowledge you encode into the representation. The graph gave the model the right relational frame, and the behavioral features gave it the right local evidence. Neither worked alone.
Working with data you can't publish
The logs were real production events — pseudonymized, but real timestamps, real cities, real client identifiers. Quasi-identifiers like that can re-identify people even when the IDs are hashed, so the data never leaves the private perimeter: not the CSVs, not the graph objects built from them, not the trained weights.
What I published instead is the full method: preprocessing and feature engineering, graph construction, models, evaluation, and the write-ups — with stripped notebook outputs and a clean git history. If you have your own auth logs, the repo is everything you need to reproduce the pipeline on them.
Handling data responsibly isn't a constraint that dilutes a project. Shown properly, it's part of the work.